
Measuring Emissions from the Top Three Production Sector Emission Sources
“If you can’t measure it, you can’t manage it.”
This famous quote is often attributed to business management expert Peter Drucker and is something you’ll hear at the Bridger Photonics office in reference to managing methane emissions. For the oil and gas industry, this phrase used to imply a “find it and fix it” strategy since you can’t fix what you can’t measure. But more recently, we’ve seen an important shift in the industry’s approach. Operators are now looking to comprehensively measure and analyze their emission sources statistically across their entire asset portfolios. Doing so can help operators better understand the root causes that inform thoughtful and effective emissions management strategies. This requires identification of the sources and tracking progress over time to reach emissions reduction goals.
Third-party research from the production sector has shown that storage tanks, flares, and compressors are often top sources of methane emissions (not always in that order), making them crucial pieces of equipment to accurately measure in order to develop a comprehensive mitigation strategy. Although these sources are key emissions drivers, they are often the most challenging to detect using ground-based technologies for several reasons.
Let's dive into three major sources of emissions: flares, tanks, and compressors.
Emissions from Flares
Flare emissions (including both lit and unlit) constitute one of the top three aggregate emission sources we measure. So, it’s critical to confidently detect and quantify methane emissions from flares to inform a comprehensive emissions management strategy.
But flares are challenging to detect and measure for several reasons:
- Flares are often not detected (or quantified) by sensors that measure the air at fixed locations near the ground. Methane is about 45% lighter than ambient air and tends to rise upon release, so flare emissions often don’t get down to the location of ground-based point sensors for detection, except under extraordinary wind circumstances. Heat from the flare, and the fact that the gas is often propelled upward from the top of the stack, exacerbate this challenge.
- Many imaging sensors don’t work “looking up” because they require the light (e.g. laser or sunlight) to scatter off a solid surface to make measurements. When a ground-based imaging sensor “looks up” at an emission from the top of a flare stack, there’s nothing but sky for the light to scatter off.
-
Emissions from lit flares comingle with combustion exhaust, which can complicate or prohibit imaging and quantification (e.g. with thermal imaging technologies like OGI).
Can Gas Mapping LiDAR detect emissions from flares?
Yes, Bridger Photonics’ Gas Mapping LiDAR technology can measure emissions from both lit and unlit flares within our stated detection sensitivity performance of 3 kg/hr with ≥90% probability of detection under typical conditions. We have demonstrated accurate detection and quantification capabilities in the presence of heat and flames. Our aerial point of view is ideal for detecting flares, and the aerial photography we gather during scans provides further insight into whether the emission is coming from an unlit flare or an inefficiently burning flare in need of repair.

Gas Mapping LiDAR’s aerial scans provide a spatial audit (the area covered by our laser) to ensure comprehensive coverage of an operator’s assets. This feature ensures there will be no systematic errors in an emissions inventory. With the data provided by Bridger, operators can develop plans to strategically reduce emissions (and fix systematic issues) across their entire asset portfolio.
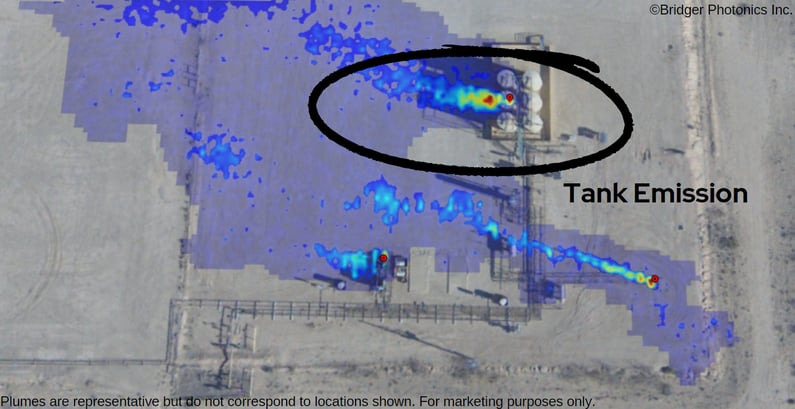
Emissions from Tanks
Several third-party studies* have found production storage tanks to be the largest source of methane emissions in some basins. A 2023 study found that even tanks with emissions controls installed had significant emissions. Tweaking operations or alerting an operator to malfunctioning thief hatches may be big wins for relatively low cost. To know where the biggest emission reduction opportunities are for an operator and to generate an accurate emissions inventory, confident detection of emissions from storage tanks is critical.
Like flares, tank emissions are difficult to measure from the ground because of the elevated emission locations. The emissions from tanks are typically released from a high point and tend to rise, since methane is lighter than air. So, these emissions can be easily missed by ground-based sensors that sample the air closer to the ground. And tanks can be frequent “blind spots” in traditional OGI camera surveys if ground crews can’t access the top of the tanks for safety reasons. In this case, the surveyor must point the OGI camera up towards the sky, which diminishes its effectiveness.
Can Gas Mapping LiDAR detect emissions from tanks?
Gas Mapping LiDAR has been shown to capture emissions from storage tanks during our aerial scans down to our standard production detection sensitivity of 3 kg/hr with ≥90% probability of detection under typical conditions. By scanning from the air, we get clear plume imagery and quantification of tank emissions, as well as comprehensive spatial coverage of an operator’s tanks. We can also typically identify which individual tanks are emitting amongst a battery of tanks.
Emissions from Compressors
Compressor emissions are another of the top three sources of emissions. We find that compressors are often the leading source of aggregate emissions in the less emissive basins like British Columbia and Denver-Julesburg. And the emissions from compressors are typically more predictable because most compressor emissions are expected as a part of the normal operation of the equipment itself (i.e. not "fugitive” emissions). Compressor emissions are often (but not always) from methane emissions found in the compressor exhaust due to incomplete combustion of the natural gas used to power the compressor, commonly known as "combustion slip," or "methane slip."
Detecting compressor emissions from the ground can be challenging because:
- The ever-present normal operating emissions from methane slip can create elevated background levels of methane and lead to “false” detection events that are not from fugitive emissions or can mask fugitive emissions.
- The emissions are very hot, making it difficult or impossible for detection or quantification using thermal infrared methane imagers because the emissions are comingled with hot combustion exhaust.
- The emissions typically emit from an elevated position and are often propelled upward, making it less likely for the emissions to reliably reach sensors near the ground. If the wind conditions do exist to waft emissions down to a sensor, the heat-and-propellant-influenced path of the emissions make it nearly impossible to accurately localize or quantify the emissions using inverse dispersion modeling.
Can Gas Mapping LiDAR detect and quantify emissions from compressors?
Gas Mapping LiDAR can detect and quantify methane emissions from compressors, including combustion slip in exhaust. We detect emissions from compressors with our standard production sector detection sensitivity of 3 kg/hr with ≥90% probability of detection under typical conditions. We have conducted testing to ensure our quantification is not corrupted by the gas temperature. We can discern combustion slip from fugitive emissions within the spatial resolution of our gas plume imagery.

The emissions we see from compressors can vary across different sets of equipment, too. Sometimes the compressor exhaust emissions are within the equipment specification, and sometimes not. Sometimes we see spatially separated sources of methane emissions from compressors in addition to exhaust. It’s important to reliably detect compressor emissions in an asset portfolio to ensure accurate emissions inventories and to develop the most effective emissions management strategy. New technologies exist, or are in development, to extract and re-inject combustion slip and to transition to electric-drive compressors.